I unpacked my bags today, and started going through my mountain of junk mail.
It’s bitterly cold on the East Coast (Boston at -6 °F/ -21°C), and frozen iguanas are falling out of the trees in Florida. Zoologists say they will ‘thaw’ again and come back to life. Here is Seattle it was a balmy 49°F/ 9°C today, with rain.
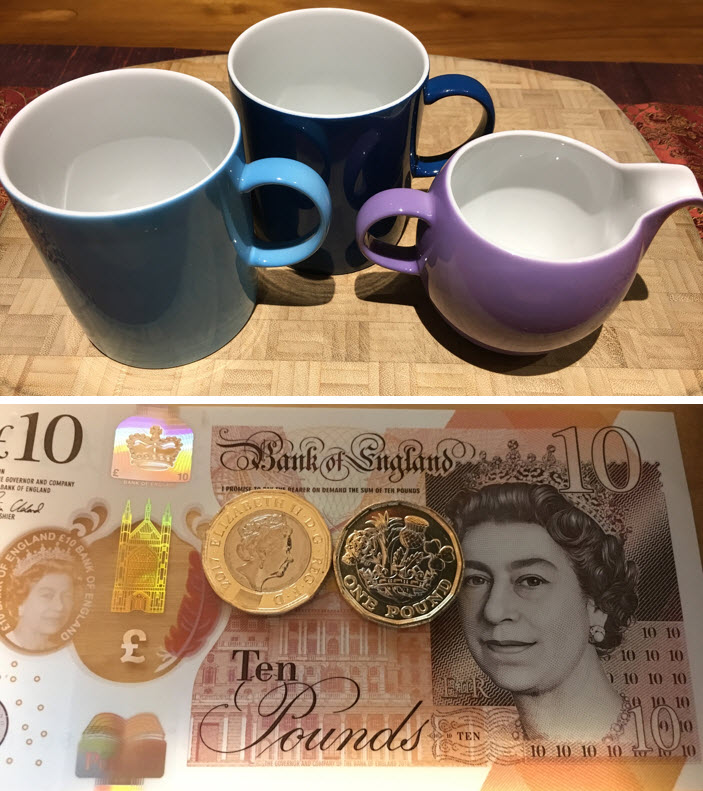
Top: My porcelain mugs and creamer survived in my luggage without breaking. It’s for my coffee in the morning, and from porcelain manufacturer Rosenthal’s factory in Selb in Bavaria, that dates back to 1879. I love the colors and the simple design. Bottom: I took advantage of my stop at Heathrow to get my grubby hands on the shiny new 12-sided one-pound coin, as well as the new £10 polymer note with its cool holographs. The first note printed was reportedly given to the Queen, the second note to Prince Philip, the third to Theresa May (Prime Minister), and the fourth to Philip Hammond (Chancellor of the Exchequer).
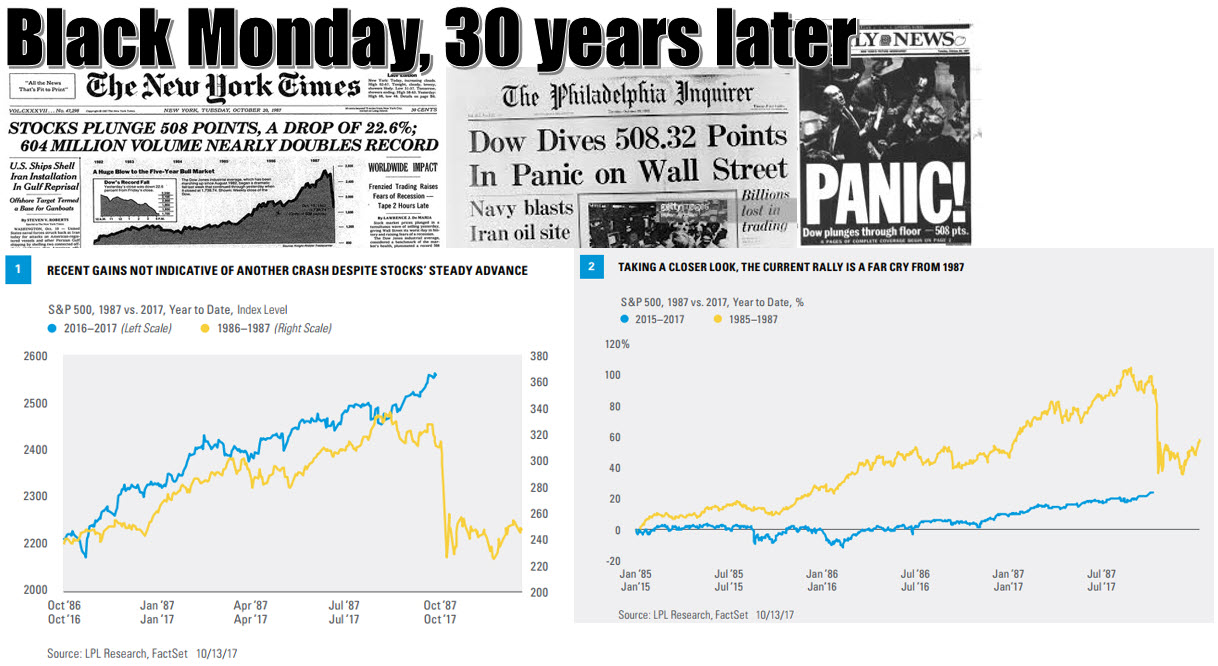
Thursday marked the anniversary of the US Stock Market crash of 1987, called Black Monday. The Dow Jones Index fell by 22.6% in one day, a record decline that stands to this day. The impact was felt worldwide. ‘It is a sobering experience’ said my dad at the time. In South Africa, the Johannesburg Stock Exchange Index would slump by 38% in the month that followed.
Under current rules, if the broader S&P 500 index falls more than 7.0% before 3:25 p.m. New York time, trading is paused for 15 minutes. If the decline continues once trading resumes, and it is still before 3:25 p.m., the market is again paused at 13% down. If the decline happens after 3:25 p.m, trading continues. But if the decline reaches 20%, trading is suspended for the session, regardless of the time of day. Still, said the traders on the floor of the New York Stock Exchange today: the forces in the market driven by fear are very powerful, and even the circuit breakers may not prevent the market from going down significantly in a very short time.
Check out the two graphs. The left one is a comparison of the S&P 500 values in 1987 (yellow) and in 2017 (blue). Looks awfully much the same, no? Actually, no. One should use percentages on the index, and not points. The run-up in the market from the start of 1985 through the 1987 peak, was more than 100%. Over an equivalent time period today (the start of 2015 through the 2017 peak), the S&P 500 is up by 24%.
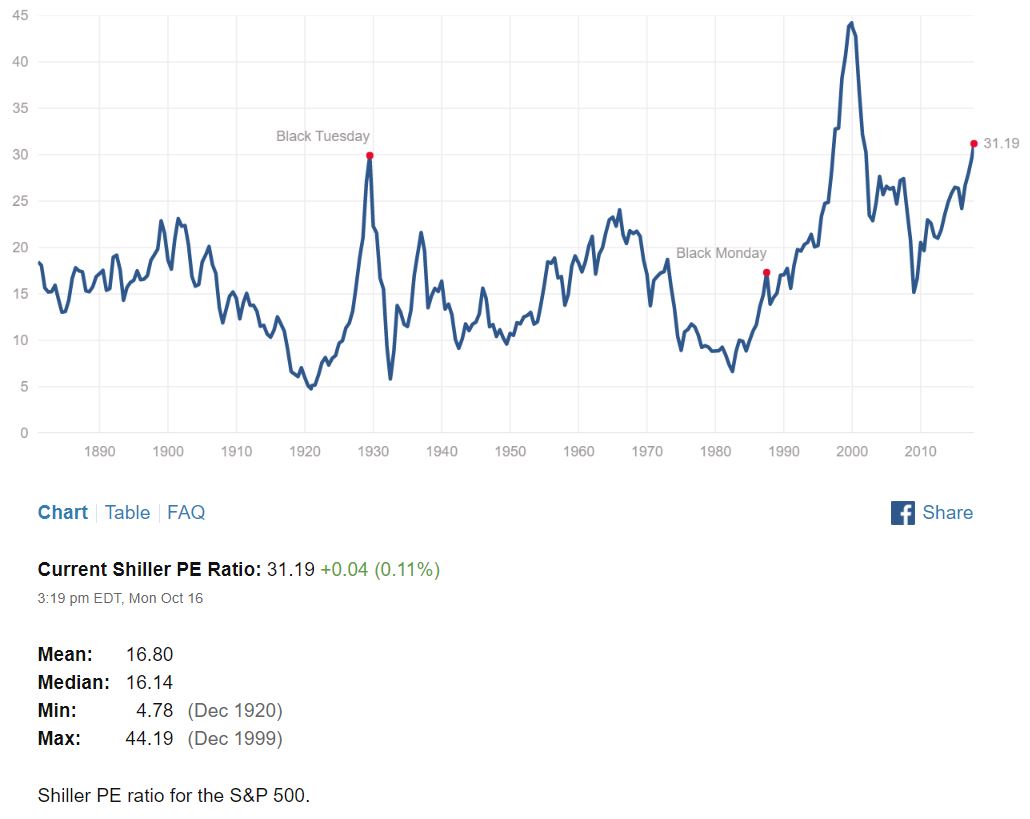
It has to be a matter of ‘when’, and not of ‘if’, when it comes to a 10% or 20% correction in the US equities market. Yale University economics professor Robert Shiller has an index called the CAPE: Cyclically Adjusted Price Earnings ratio (it takes inflation into account). The index has only been higher before the 1929 crash, and before the 2000 dot-com bubble. It is now over 30, and – if history repeats itself- it has to go back to the trend value of 16-something. Sooner, or later. We just do not know when.
Graph compiled from Robert Shiller’s CAPE index data. Look at what happened after 2000 – the index went from 45 to 23. Then after the 2008 Financial Crisis, it went to 15.
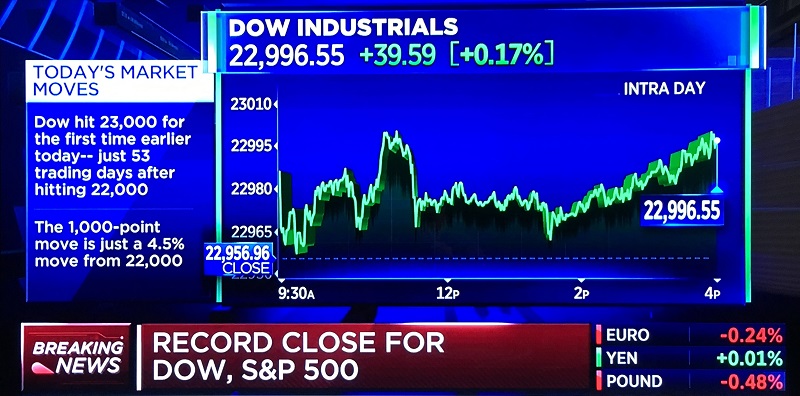
Update Tue: the Dow Jones Industrial Average briefly crossed 23,000 for the first time on Tuesday. There is already speculation that 25,000 is possible by June 2018. (Agreed. But let’s add: 20,000 is also perfectly possible).
Screen shot at the close of the trading day Tuesday, from CNBC business channel. (Called the ‘stock market cheerleader channel’ by some analysts).