I have been counting the days after Wednesday, April 14 when I got my first Covid-19 vaccine shot.
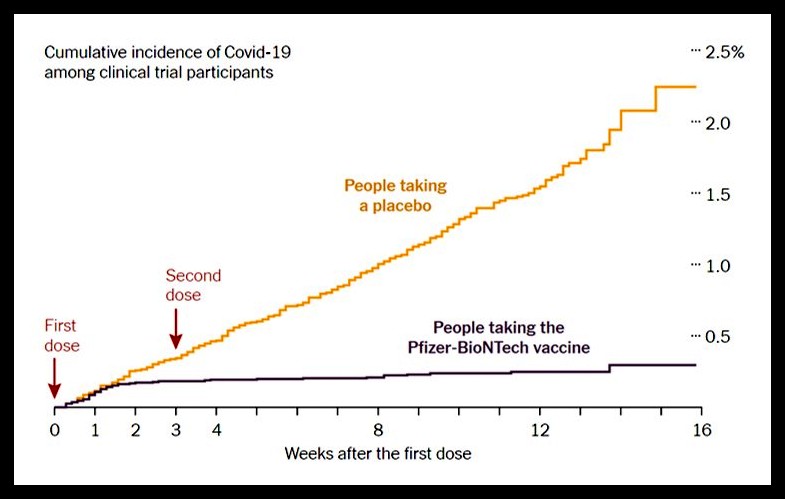
The graph below has been doing the rounds on Twitter, and has been featured in articles about the Pfizer-BioNTech vaccine.
It was compiled in 2020 by Pfizer with data from the vaccine trials.
New coronavirus cases quickly tapered off in the vaccinated group of volunteers about 10 days after the first dose*. In the placebo group, cases kept steadily increasing.
The second dose boosts and extends the protection (for at least 6 months, possibly for much longer).
*If someone in the vaccinated group did get infected, the symptoms were milder, and there were no fatalities, either.

I’m in the vaccinated group and at the ‘2’ on the graph’s timeline, and heading for the ‘3’ next Wednesday when I will get my second shot.
