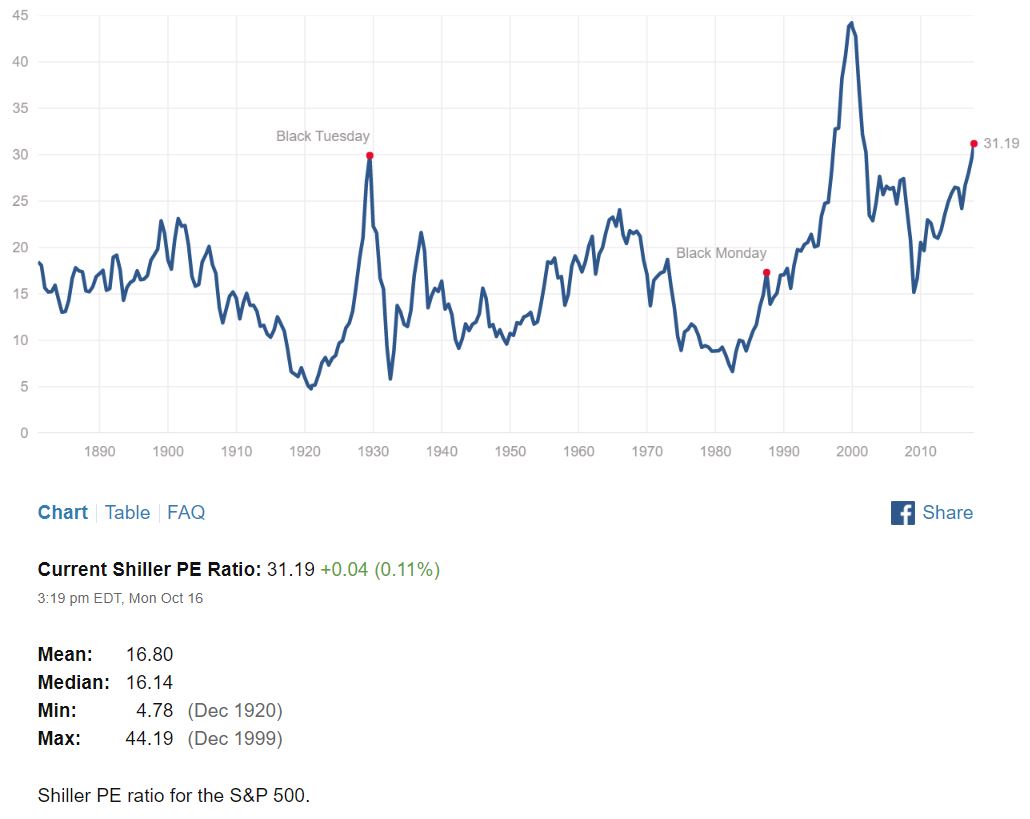
It has to be a matter of ‘when’, and not of ‘if’, when it comes to a 10% or 20% correction in the US equities market. Yale University economics professor Robert Shiller has an index called the CAPE: Cyclically Adjusted Price Earnings ratio (it takes inflation into account). The index has only been higher before the 1929 crash, and before the 2000 dot-com bubble. It is now over 30, and – if history repeats itself- it has to go back to the trend value of 16-something. Sooner, or later. We just do not know when.
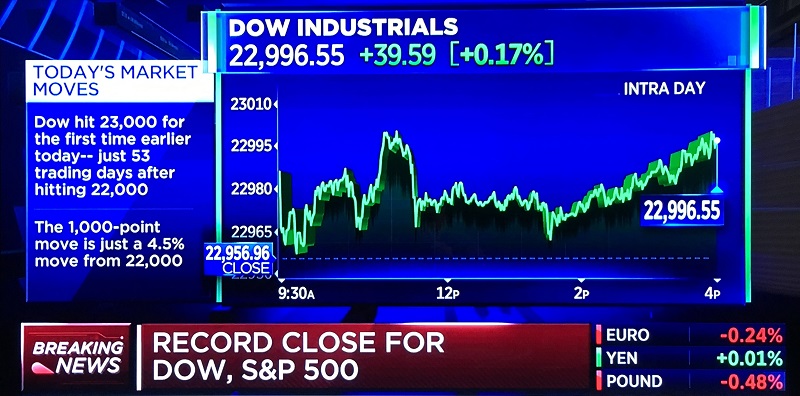
Update Tue: the Dow Jones Industrial Average briefly crossed 23,000 for the first time on Tuesday. There is already speculation that 25,000 is possible by June 2018. (Agreed. But let’s add: 20,000 is also perfectly possible).